Activities meet the following objectives:
- understand that the effects of natural disasters are worse in poor places than in wealthy places;
- plan and participate in a service learning project to address poverty.
- How does poverty affect the impact of natural disasters?
- How does poverty differ from country to country?
- How can poverty be eradicated?
- Graph 1: Loss of Life from a 7.0 Earthquake
- Graph 2: Income Per Person
- Graph 3: People Living in Poverty
- Handout: Connections Between Poverty and Earthquakes
Vocabulary
poverty [ˈpävərtē ] (noun) The United Nations defines people in poverty as those who live on less than $2 a day. United States guidelines for 2009 define poverty as a family of four living on $22,050 or less per year (or less than $62 per day). That amount is updated every year, and government agencies use it to determine eligibility for certain government programs.
extreme poverty [ ikˈstrēm ˈpävərtē ] (noun) The United Nations defines people in extreme poverty as those living on less than $1 a day.
areas of concentrated poverty [ˈe(ə)rēəs əv ˈkänsənˌtrātid ˈpävərtē ] (noun) Areas in the United States where 40 percent or more of the population lives in poverty.
Overview
In 1989 a magnitude 7.1 earthquake struck San Francisco. Sixty-three people died. This year, a 7.0 earthquake struck Haiti. A month after the disaster the Haitian government estimates that more than 200,000 people died. Why the huge difference? In this lesson students will answer that question as they identify and explore connections between poverty and natural disasters.
Procedure
a. Poverty is a word that means not having enough of the things that you need to live. Someone who lives in poverty is said to be poor. What kinds of things do you need in order to live? (Write the items on the board, as students call them out.)
b. As you know, there was a big earthquake in Haiti in January. What do you know about the earthquake? What pictures have you seen? In this lesson you’re going to look at the earthquake and at poverty. You’re going to see that there’s a connection between them.
2. In small groups, look at the graph called Loss of Life from a 7.0 Earthquake.
a. Look at the line across the bottom. (It’s called the horizontal line because it goes side to side, like the horizon.) What two countries do you see identified there? This graph is going to compare the two countries.
b. Now look at the vertical line. What does the label say it shows? When you think about the two lines together, what is the graph showing?
3. Have one member of your group write one sentence on the handout that states what the graph says. Have volunteers share their sentences with the class. (On the board, write a summary sentence based on student answers.)
4. Using the steps you used to “read” the information in the first graph, read the information in this second graph called Income Per Person. Write a one-sentence summary of the information on the page with the graph. Share your sentence. (On the board, write a summary sentence based on student answers.)
5. Look at the third graph, People Living in Poverty. Share summary sentences, and write one on the board. (Follow the same procedure as before.)
6. The reason you’ve looked at graphs about the earthquakes’ death tolls and poverty is because they are related. To figure out how, complete the handout called Connections Between Poverty and Earthquakes.
7. How can you use what you’ve learned about poverty and natural disasters? As a class, identify some actions you might be able to take to address poverty. If you want to act locally, for example, you could organize a canned food drive or collect pennies to donate to a homeless shelter. If you want to help earthquake survivors in Haiti, you might contact the local Red Cross and see how you can contribute. Or as a way of doing both, maybe you want to do a project where you teach people in your community what you’ve learned about how poverty makes the effects of natural disasters worse. Together, create an action plan and take the steps to complete it. When you’re done, reflect on your activity. Discuss how what you learned in this lesson shaped your class project, and how your project addressed the problems you identified in your studies.
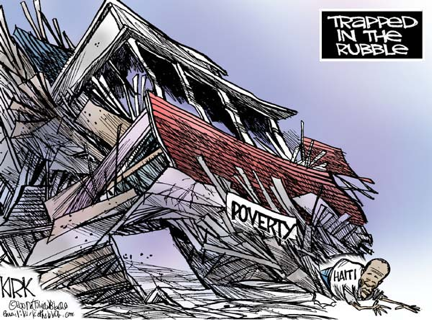
Political Cartoon
Cartoons are a kind of visual shorthand. Cartoonists draw pictures to make a point. This cartoon answers the same question you answered in this lesson: How are poverty and the effects of natural disasters connected? What answer does the cartoon give? Make your own cartoon based on what you have learned in this lesson. Share it with the class.
Reprinted with permission. Teachers may purchase individual cartoons for other lesson plans at PoliticalCartoons.com.